The network diagnostic command center for everyone on the wire.
The diagnostic command center for everyone on the wire. MTR, packet capture, looking glass, DNS, traceroute — every network test your team actually runs, fused into one native app for Mac, Windows, and Linux. White-label it in your brand, and kill the middle-man with a single diagnostic key that streams customer results straight into your dashboard.
MTR, packet capture, looking glass, DNS, traceroute — every network test your team actually runs, packaged as a real native application on Mac, Windows, and Linux. No command line. No sketchy unsigned binaries that set off SmartScreen, Gatekeeper, and every AV on the customer's box. Just a code-signed, notarized app with a real UI — white-labeled in your brand, and wired to kill the middle-man with a single diagnostic key.
Test Types
Support Tickets
Resolution Time
Native Platforms
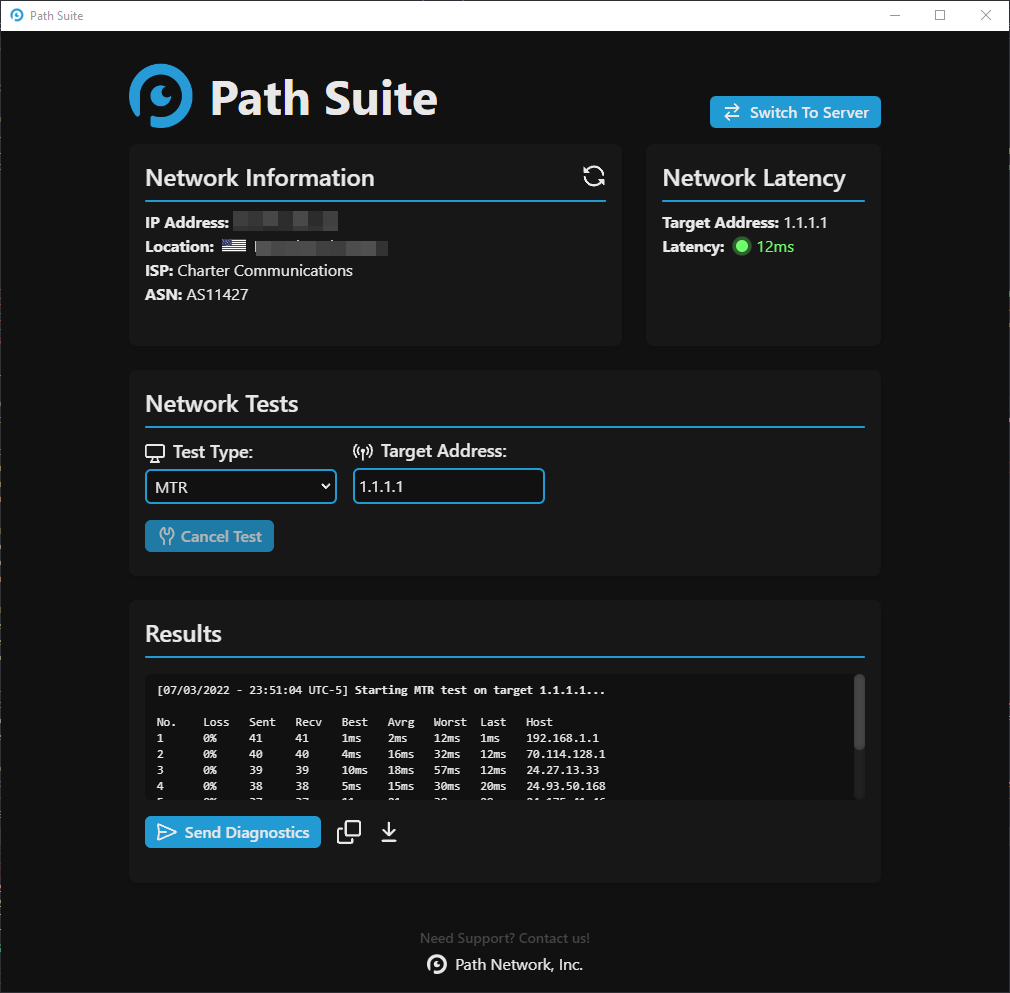
Not a terminal. Not a webapp. A real desktop application with real panels, real controls, and every diagnostic your team runs fused into one screen. The preview below is the actual app layout — auto-cycling through every test type, live.
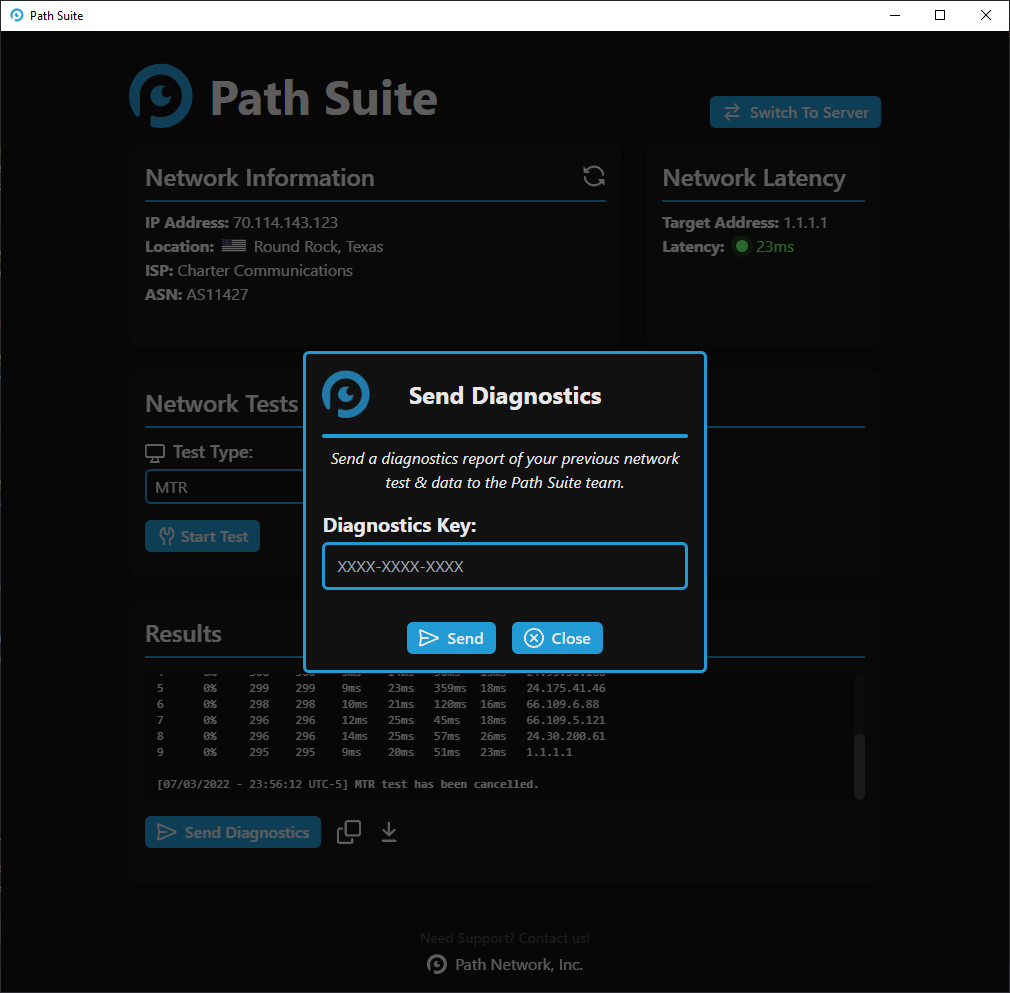
A hosting ticket shouldn't take four messages and a screenshot. Paste a diagnostic key and your customer's results stream directly into your dashboard — no copy-paste, no forwarding, no game-of-telephone.
Not a webapp. A real desktop binary on macOS, Windows, and Linux — each one shipped in the installer format your team already deploys.
Every raw MTR binary on GitHub trips SmartScreen, Gatekeeper, and every AV on your customer's machine. Half of them bail before they ever run it. We ship code-signed, notarized installers that open without a single warning dialog.
Microsoft Defender SmartScreen prevented an unrecognized app from starting.
Do you want to allow this app to make changes to your device?
Drop in your logo. Pick your palette. Name it whatever you want. Your customers download your app — the Network Suite engine just runs underneath.
Not a generic looking glass — a live view of your own network. Your datacenters, your upstream carriers, your peering sessions. Your customers and internal team run tests against your real infrastructure, straight from the app, and see the exact path their packets take through your backbone.
If your business depends on packets arriving where they're supposed to, the Network Suite earns its seat on every engineer's desktop.
Eight things on the flat-fee license — every diagnostic tool, white-label branding, signed installers, a custom lookging glass, and an unlimited seat count.
First-party desktop app for every major platform — no terminal-only fallback, no compromised UI when an engineer is on Windows. Same UX, same feature set, signed installers everywhere.
Every classic network diagnostic in one console — bidirectional MTR, latency-aware ping, hop-by-hop traceroute, recursive and authoritative DNS, reverse-DNS lookups. All streaming live, no polling.
In-app packet capture with BPF filter syntax, color-coded protocol decoding, and direct export to Wireshark .pcap. No separate tool, no kernel-module install, no admin-prompt dance.
A built-in looking glass running across your network — query routes from Frankfurt, São Paulo, Tokyo, or any edge in seconds. Ideal for diagnosing peering and asymmetric routing.
Generate a one-tap diagnostic key, hand it to a customer, get their full route + DNS + capture trace back encrypted — without screen-share, screenshots, or a back-and-forth ticket trail.
Diagnostics stream live as they run — no polling intervals, no 'click to refresh.' MTR re-rolls every cycle, packet capture lights up frames as they arrive on the wire.
Ship the suite with your logo, your color palette, and your support links — full branded chrome, no Atlas wordmark required. Useful for ISPs, MSPs, and ops teams running internal tooling.
Build installers signed with our code-signing certificate so Windows SmartScreen and macOS Gatekeeper trust the binary on first run — no 'unidentified developer' prompt for your users.
One license fee, unlimited engineer seats, unlimited deployments inside your org. No per-seat metering, no seat-pool counting, no 'enterprise tier' to unlock the basics.
Branded, signed, and streaming live diagnostics into your dashboard — in days. We handle the plumbing. You put your logo on it.
Real questions from buyers and integrators — straight answers.
A native diagnostic command center for Mac, Windows, and Linux that fuses MTR, packet capture, looking glass, traceroute, DNS lookup, BGP probing, and more into a single app — all 14+ tests your network team actually runs, in one place, on every operating system.
Yes. Brand it in your colors and logo, ship a single diagnostic key, and customer test results stream directly into your support dashboard — eliminating screenshot back-and-forth and the WinMTR-via-email loop.
From your own looking glass network, and directly from the user's local machine — giving you both the customer perspective and a clean, third-party reference. Side-by-side comparison makes ISP-side problems obvious in seconds.
WinMTR is Windows-only, stops at MTR, and is all manual. PingPlotter has no looking-glass network or packet capture. Wireshark is powerful but unforgiving for end users. Network Suite covers all three jobs — visual MTR, looking glass, and capture — in one cross-platform app any customer can run.
MTR, traceroute (ICMP, UDP, TCP), ping, DNS lookup with authoritative chase, looking glass, BGP route inspection, packet capture with on-device decode, latency-over-time charts, jitter, and speed test against the nearest probe — 14+ tools total.
Yes. End-user installs are free across Mac, Windows, and Linux. The white-label tier is the commercial product — ISPs, hosting companies, and managed-service providers unlock the direct results transfer diagnostic key.
Capture files stay on the user's machine by default. The diagnostic key can opt-in to upload sanitized summary metadata (latency, packet loss, route hops) to your dashboard, but raw captures are never sent without explicit user consent.